http://en.wikipedia.org/wiki/Parabolic_SAR
The Parabolic SAR is calculated almost independently for each trend in the price. When the price is in an uptrend, the SAR appears below the price and converges upwards towards it. Similarly, on a downtrend, the SAR appears above the price and converges downwards.
At each step within a trend, the SAR is calculated ahead of time. That is, tomorrow's SAR value is built using data available today. The general formula used for this is:
Where SARn and SARn + 1 represent today's and tomorrow's SAR values, respectively.
The extreme point, EP, is a record kept during each trend that represents the highest value reached by the price during the current uptrend — or lowest value during a downtrend. On each period, if a new maximum (or minimum) is observed, the EP is updated with that value.
The α value represents the acceleration factor. Usually, this is set to a value of 0.02 initially. This factor is increased by 0.02 each time a new EP is recorded. In other words, each time a new EP is observed, it will increase the acceleration factor. This will then quicken the rate at which the SAR converges towards the price. To keep it from getting too large, a maximum value for the acceleration factor is normally set at 0.20, so that it never goes beyond that. For stocks trading, it is preferable to set the acceleration factor to 0.01, in order to be less sensitive to local decreases. For commodity or currency trading, it is preferable to use a value of 0.02.
The SAR is iteratively calculated for each new period using this recursive definition. There are, however, two special cases that will modify the SAR value:
If tomorrow's SAR value lies within (or beyond) today's or yesterday's price range, the SAR must be set to the closest price bound. For example, if in an uptrend, the new SAR value is calculated and it results to be greater than today's or yesterday's lowest price, the SAR must be set equal to that lower boundary.
If tomorrow's SAR value lies within (or beyond) tomorrow's price range, a new trend direction is then signaled, and the SAR must "switch sides."
Upon a trend switch, several things happen. The first SAR value for this new trend is set to the last EP recorded on the previous trend. The EP is then reset accordingly to this period's maximum. The acceleration factor is reset to its initial value of 0.02.
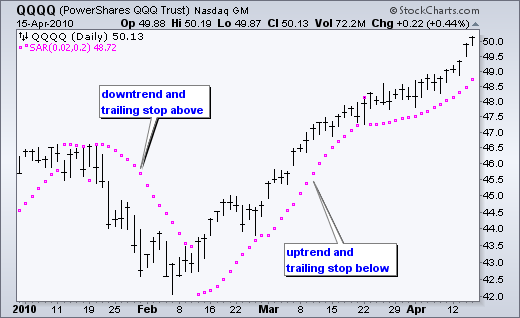
Developed by Welles Wilder, the Parabolic SAR refers to a price and time based trading system. Wilder called this the "Parabolic Time/Price System". SAR stands for "stop and reverse", which is the actual indicator used in the system. SAR trails price as the trend extends over time. The indicator is below prices when prices are rising and above prices when prices are falling. In this regard, the indicator stops and reverses when the price trend reverses and breaks above or below the indicator.
Wilder introduced the Parabolic Time/Price System in his 1978 book, New Concepts in Technical Trading Systems. This book also includes RSI, Average True Range and the Directional Movement Concept (ADX). Despite being developed before the computer age, Wilder's indicators have stood the test of time and remain extremely popular.
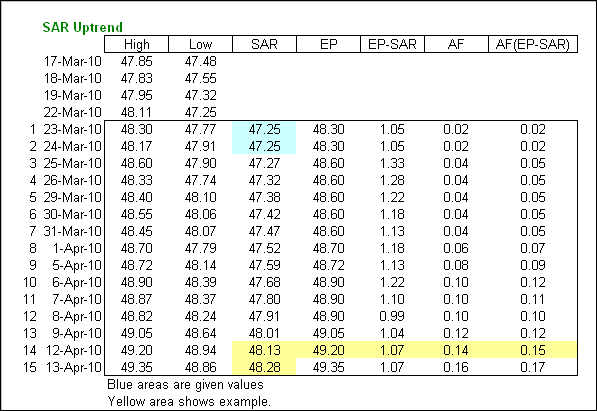
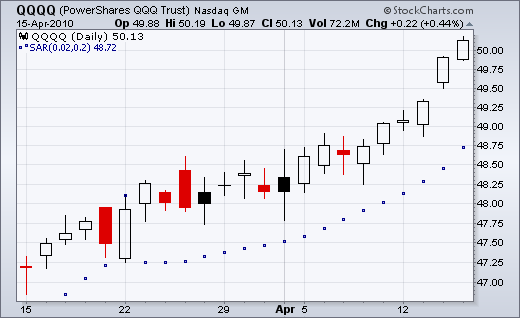
Calculation of SAR is complex with if/then variables that make it difficult to put in a spreadsheet. Feel free to skip to the interpretation section! These examples will provide a general idea of how SAR is calculated. Because the formulas for rising and falling SAR are different, it is easier to divide the calculation into two parts. The first calculation covers rising SAR and the second covers falling SAR.
Rising SAR

Prior SAR: The SAR value for the previous period.

Extreme Point (EP): The highest high of the current uptrend.

Acceleration Factor (AF): Starting at .02, AF increases by .02 each time the extreme point makes a new high. AF can reach a maximum
of .20, no matter how long the uptrend extends.

Current SAR = Prior SAR + Prior AF(Prior EP - Prior SAR)
13-Apr-10 SAR = 48.28 = 48.13 + .14(49.20 - 48.13)

The Acceleration Factor is multiplied by the difference between the Extreme Point and the prior period's SAR. This is then added to the
prior period's SAR. SAR can never be above the prior period's low or the current low. Should SAR be below one of these, use the lowest
of the two for SAR.
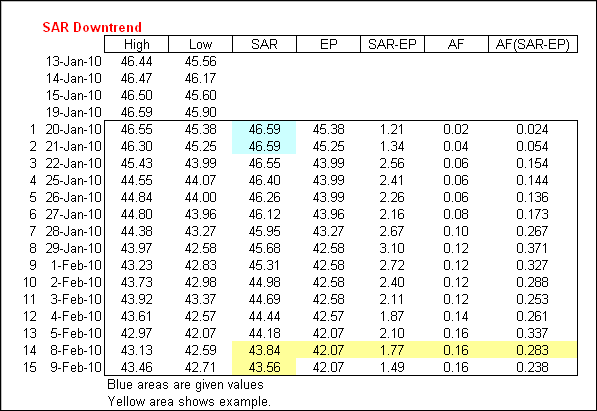
Falling SAR

Prior SAR: The SAR value for the previous period.

Extreme Point (EP): The lowest low of the current downtrend.

Acceleration Factor (AF): Starting at .02, AF increases by .02 each time the extreme point makes a new low. AF can reach a maximum of .20,
no matter how long the downtrend extends.

Current SAR = Prior SAR - Prior AF(Prior SAR - Prior EP)
9-Feb-10 SAR = 43.56 = 43.84 - .16(43.84 - 42.07)

The Acceleration Factor is multiplied by the difference between the Prior period's SAR and the Extreme Point. This is then subtracted
from the prior period's SAR. SAR can never be below the prior period's high or the current high. Should SAR be below one of these,
use the highest of the two for SAR.
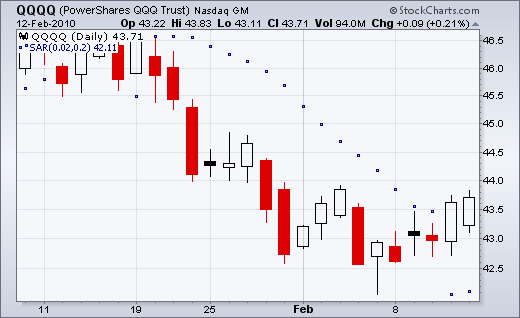
SAR follows price and can be considered a trend following indicator. Once a downtrend reverses and starts up, SAR follows prices like a trailing stop. The stop continuously rises as long as the uptrend remains in place. In other words, SAR never decreases in an uptrend and continuously protects profits as prices advance. The indicator acts as a guard against the propensity to lower a stop-loss. Once price stops rising and reverses below SAR, a downtrend starts and SAR is above the price. SAR follows prices lower like a trailing stop. The stop continuously falls as long as the downtrend extends. Because SAR never rises in a downtrend, it continuously protects profits on short positions.
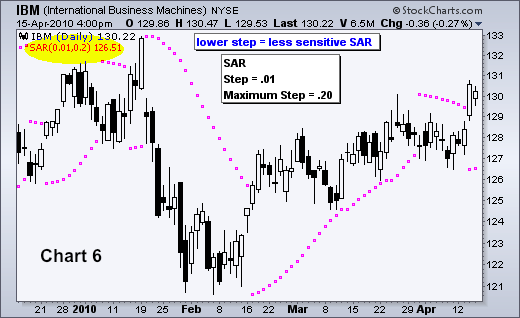
The Acceleration Factor (AF), which is also referred to as the Step, dictates SAR sensitivity. SharpCharts users can set the Step and the Maximum Step. As shown in the spreadsheet example, the Step is a multiplier that influences the rate-of-change in SAR. That is why it is referred to as the Acceleration Factor. Step gradually increases as the trend extends until it hits a maximum. SAR sensitivity can be decreased by decreasing the Step. A lower step moves SAR further from price, which makes a reversal less likely.
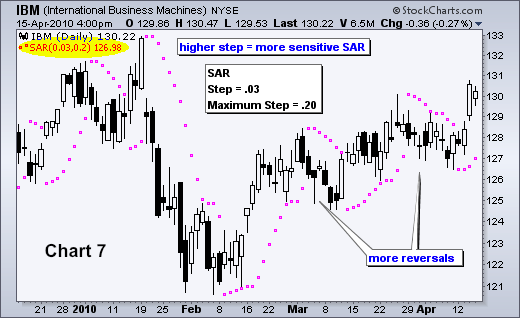
SAR sensitivity can be increased by increasing the step. A higher step moves SAR closer to the price action, which makes a reversal more likely. The indicator will reverse too often if the step is set too high. This will produce whipsaws and fail to capture the trend. Chart 6 shows IBM with SAR (.01, .20). The step is .01 and the Maximum Step is .20. Chart 7 shows IBM with a higher Step (.03). SAR is more sensitive in chart 7 because there are more reversals. This is because the Step is higher in chart 7 (.03) than chart 6 (.01).
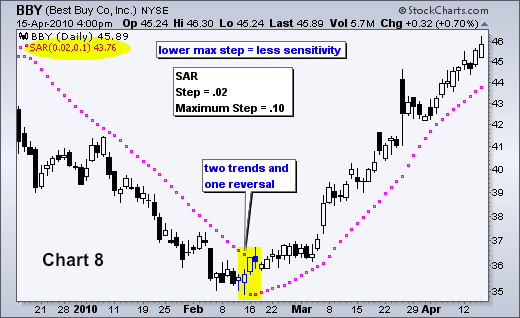
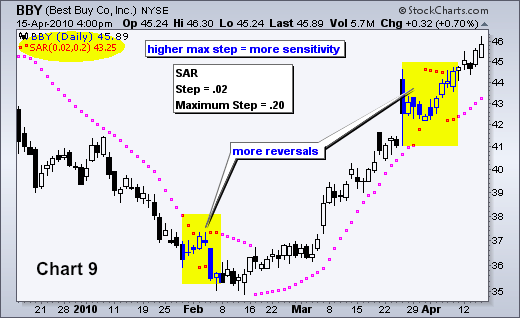
The sensitivity of the indicator can also be adjusted using the Maximum Step. While the Maximum Step can influence sensitivity, the Step carries more weight because it sets the incremental rate-of-increase as the trend develops. Also note that increasing the Step insures that the Maximum Step will be hit quicker when a trend develops. Chart 8 shows Best Buy (BBY) with a Maximum Step (.10), which is lower than the default setting (.20). This lower Maximum Step decreases the sensitivity of the indicator and produces fewer reversals. Notice how this setting caught a two month downtrend and a subsequent two month uptrend. Chart 9 shows BBY with a higher Maximum Step (.20). This higher reading produced extra reversals in early February and early April.
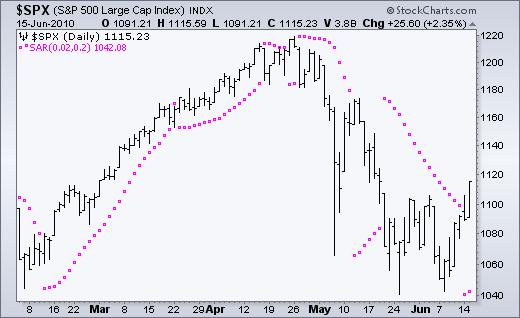
The Parabolic SAR works best with trending securities, which occur roughly 30% of the time according to Wilder's estimates. This means the indicator will be prone to whipsaws over 50% of the time or when a security is not trending. After all, SAR is designed to catch the trend and follow it like a trailing stop. As with most indicators, the signal quality depends on the settings and the characteristics of the underlying security. The right settings combined with decent trends can produce a great trading system. The wrong settings will result in whipsaws, losses and frustration. There is no golden rule or one-size-fits-all setting. Each security should be evaluated based on its own characteristics. Parabolic SAR should also be used in conjunction with other indicators and technical analysis techniques. For example, Wilder's Average Directional Index can be used to estimate the strength of the trend before considering signals.
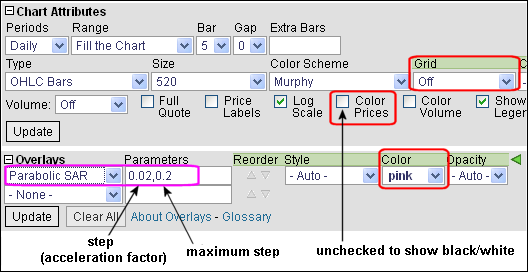
The Parabolic SAR can be found as an Overlay in SharpCharts. The default parameters are .02 for the Step and .20 for the Maximum Step. As shown above, these can be changed to suit the characteristics of an individual security. The example below shows the indicator in pink with prices in black/white and the chart grid removed. This contrast makes it easier to compare the indicator with the price action of the underlying security. Click here for a live example of Parabolic SAR.
Break above falling SAR: This scan starts with stocks that have an average price of $10 or greater over the last three months and average volume greater than 40,000. The scan then filters for stocks that have a bullish SAR reversal (Parabolic SAR (.01,.20)). This scan is just meant as a starter for further refinement.
Break below rising SAR: This scans starts with stocks that have an average price of $10 or greater over the last three months and average volume greater than 40,000. The scan then filters for stocks that have a bearish SAR reversal (Parabolic SAR (.01,.20)). This scan is just meant as a starter for further refinement.