Interplanetary ¡°Day After Tomorrow?¡±
Part 2
An Enterprise Mission Hyperdimensional Report
Richard C. Hoagland
David Wilcock
Copyright © 2004
Overview
The significant ¨C nay, unprecedented -- weather changes, currently alarming millions here on Earth, are ultimately part of an overall, mysterious transformation that is affecting the Sun, a number of other planets and many of their satellites¡ all across the solar system.
As noted in Part 1, in this Report we shall be citing specific scientific papers backing up these ¡°system-wide,¡± apparently systemic changes -- evidence derived from published, mainstream sources, compiled by researchers at major institutions, who obviously (from the authors¡¯ own comments) haven¡¯t themselves fully grasped the magnitude (to say nothing of the underlying cause) of what they¡¯re seeing¡ or, why they¡¯re seeing it right now.
The ¡°cause and effect¡± of these remarkable planetary transformations, we believe, is explained by appealing to a new form of Physics -- not yet embraced by most of mainstream science. In fact, this is an ¡°old Physics¡± -- once the centerpiece of 19th Century, pre-quantum reality. At its most fundamental, it is a Physics based on the literal accessibility of ¡°higher dimensions.¡±
This ¡°higher dimensional/hyperdimensional¡± description is not just an abstract concept, left over from a few mathematicians a hundred years ago -- but is a serious, quantifiable new model, regarding the real domain of energies that invisibly flow into and out of our ¡°three-dimensional¡± reality¡ literally creating in the process all of physical matter¡ as well as its observed, three-dimensional, highly complex interactions.
In addition to its fundamental hyperdimensional component, this ¡°new Physics¡± is intimately coupled to a modified concept of a spatial ¡°aether.¡± This ¡°aether,¡± however, is distinctly different from another old 19th Century concept ¨C an ¡°electromagnetic aether,¡± proposed then as a medium (analogous to air or water) necessary to carry rhythmic light and radio vibrations across ¡°empty space.¡± This ¡°new aether¡± also has no connection to the now popular term ¡°zero point energy¡± -- the current quantum mechanics description of vacuum processes proposed by mainstream physics to generate matter and energy from empty space.
This new, modified aether is, in fact, a ¡°massless, non-electromagnetic aether¡± ¨C a charge-free transfer medium pervading all of space, and conveying ¡°hyperdimensional energy¡± from more complex, higher dimensions¡ into ¡°our¡± dimension.
In the model of Hyperdimensional Physics proposed by one of us (Hoagland), it is the innate rotation of mass in three dimensions (or, the gravitational revolution of ¡°one mass around another mass, via an orbit¡±) that opens up a literal ¡°rift,¡± or ¡°gate,¡± between dimensions. ¡°HD energy¡± flows through this gate, modifying the massfree aether in this dimension -- creating a variety of observable and measurable physical effects, including the cyclic appearance of matter and energy in our dimension. The overall quantity of energy ¡°gated¡± into this dimension is directly proportional to ¡°the total amount of angular momentum¡± in the spinning or gravitating system involved¡
In an orbital system, this total quantity is also ¡°modulated¡± -- by the constantly changing geometric relationships between the various masses in their orbits; certain ¡°tetrahedral¡± angles (60 and 120 degrees), allow maximal energy transmission between dimensions; while other angles (90 and 180 degrees) interfere with that transmission and restrict it¡ These geometric effects are due to the inevitable ¡°resonance and dissonance effects¡± of interfering wave patterns in the underlying aether ¡°matrix.¡±
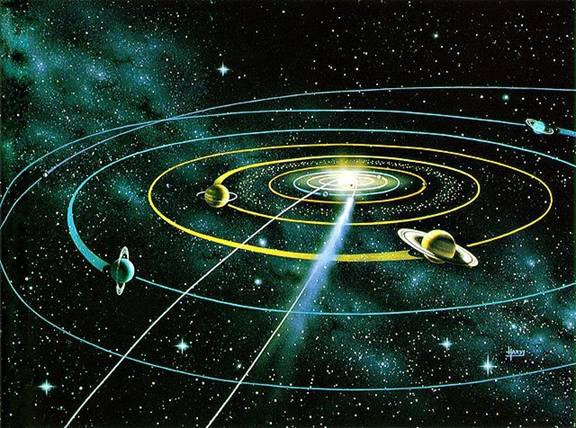
The simplest solar system analogy would be ¡°multiple ripples on a pond¡± ¨C with the overlapping ¡°energy ripples¡± being the vast range of frequency alterations of the underlying massfree aether, caused by the hyperdimensional energy entry into our dimension via the rotating Sun, its rotating and orbiting planets¡ and their rotating and orbiting moons (see illustration, below).
In other words -- the entire ¡°solar system¡± functions as a real, hyperdimensional, interconnected, resonant (or at times, dissonant) system¡
The dramatically changing planetary effects we are about to recount in this Report, we believe, are a direct result (in the Hoagland Model) of these complex spins and geometrically-changing orbits of the solar system¡¯s currently known planetary members, and their quantifiable effects on this underlying resonant aether pattern¡ augmented (in this Model) by additional, yet undiscovered planets that are also affecting the pattern ¨C but which are orbiting far beyond the boundaries of the presently known solar system¡
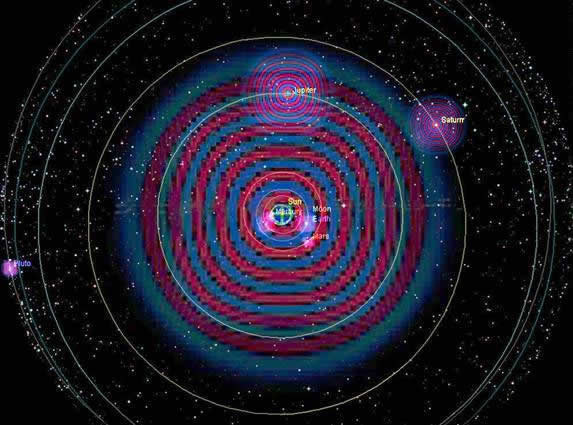
Figure 1 ¨C Hyperdimensionally resonant solar system. (Hoagland)
By far the most complete laboratory work on the basic properties of this underlying, critical ¡°HD transfer aether¡± -- required in Hoagland¡¯s Model to transmit the hyperdimensional information into our dimension -- has been carried out by Dr. Paulo and Alexandra Correa. A comprehensive overview of their extensively documented research and experiments can be viewed at aetherometry.com. The late Dr. Eugene Mallove, former Head Science Writer at MIT, and former President of the New Energy Foundation, as well as Editor in Chief of its scientific journal, Infinite Energy, described it thus:
¡°What is Aetherometry and how to begin to understand it? It comprises the study and measurement of the aether -- not the static, electromagnetic luminiferous aether of the 19th Century, but a dynamic non-electromagnetic aether that is amenable to measurement through the deflection of electroscope leaves, mercury thermometers, Geiger-Muller tubes, oscilloscopes, Tesla coils, Faraday cages, and other commonly available instruments and circuit elements. Of course, anyone who is a close-minded believer in Einsteinian relativity -- the Special or General theories -- would find little or no reason to investigate Aetherometry¡¡±
While the Correas¡¯ work is entirely separate from our own, both authors strongly believe that there is a fundamental connection between a ¡°massfree aether,¡± and the equally demonstrable hyperdimensional energies it is conveying into our three spatial dimensions. Further experimental work ¨C including some unique ¡°HD aether measurements¡± the Enterprise Mission intends to carry out during the up-coming Venus Transit of the Sun, June 8, 2004 -- will advance efforts to ultimately prove or disprove such a critical connection.

Figure 2 ¨C The new ¡°massless aether¡± experiments. (Correas)
Hoagland's ¡°magnum opus¡± -- The Monuments of Mars: A City on The Edge of Forever (North Atlantic Books, Berkeley, 1987) -- proposed the first 20th Century restatement of the old 19th Century Hyperdimensional and Aether Model, coupled with the specific discovery of hyperdimensional planetary features identified via contemporary telescope and spacecraft observations. Hoagland showed that ¡°geometric resonant energy fields¡± within these nearby planets directly affect their observable ¡°atmospheric signatures,¡± as well as the critical location of major surface features ¨C such as the latitude of the largest shield volcanoes.
Specifically, the focus was on the simple geometric solid known as a ¡°tetrahedron¡± -- a four-sided object, with each side as an equilateral triangle. Like the other four Platonic Solids -- the ¡°octahedron, cube, dodecahedron and icosahedron¡± -- the tetrahedron will fit perfectly inside of a sphere. If one of its tips is aligned with the north pole of a rotating, planetary sphere -- then the other three points will all emerge at 19.5 degrees, south of the equator. Similarly, if a tetrahedron is hypothetically placed inside with one tip pointing towards the south pole, the other three ¡°vertices¡± will emerge at 19.5 degrees north of the equator:
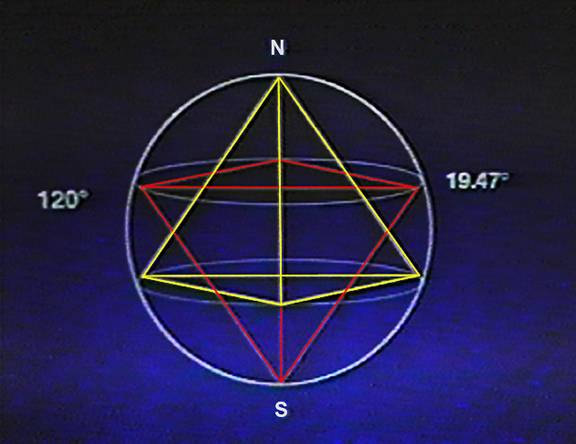
Figure 3 - Tetrahedral geometry within rotating sphere. (Hoagland)
As explained in a series of Hyperdimensional Physics papers (www.enterprisemission.com) authored by Hoagland et al., many planetary energy phenomena are seen to emerge directly at this critical 19.5-degree latitude on a variety of planets. Gaseous worlds reveal uniquely energetic cloud bands at these latitudes and giant spiraling vortexes at the exact tips of the tetrahedral geometry -- such as the Great Red Spot on Jupiter, and the Great Dark Spot on Neptune. Solid planets tend to demonstrate the largest volcanic ¡°upwelling, hotspot activity¡± at those latitudes -- such as the Big Island of Hawaii on Earth, and Olympus Mons on Mars¡

Figure 4 ¨C Resonant ¡°tetrahedral energy pattern¡± inside spinning Jupiter, producing Great Red Spot. (Hoagland)
In this Report, we will combine Richard C. Hoagland¡¯s Hyperdimensional Physics Model (published at http://www.enterprisemission.com/hyper1.html), with David Wilcock¡¯s Convergence Model, as expressed in his third book, Divine Cosmos, published at http://ascension2000.com/DivineCosmos. We believe this synthesis can most easily explain the ¡°mysterious¡± solar system changes currently occurring. When this paper refers to ¡°the Hyperdimensional Physics Model,¡± both of these sources are being drawn from in that definition. It is outside the scope of this presentation to fully identify and prove all the postulates of these overlapping HD Models (or their individual variations), so these cited documents should be consulted for a more complete understanding of both authors¡¯ work. For someone reading this who tends toward the non-technical, here are a couple of additional analogies.
Magnetism is not a directly visible energy ¡ but we know it is there, because of its effects on other things. By the same token, beneath the surface of a body of water, you can¡¯t tell which direction the currents are flowing ¡ except by observing other physical things that the water is moving -- such as particles of sand or sunken leaves. Hyperdimensional energy is not directly visible either ¨C but we can see its effects throughout the entire solar system, such as through the emergence of anomalous dust, gas and ionized particles, as well as otherwise-inexplicable geometric phenomena in certain fluid (planetary atmospheric) systems, which appear to be the result of pressure currents caused by resonant vibrations in some hyperdimensional/massless aether ¡°fluid¡±. (See ¡°The Matrix is a Reality¡± by Wilcock at http://ascension2000.com/04.10.03.htm for a quick overview.)
So, on to our examples.
* * *
The Sun
Since at least the late 1970s, the Sun¡¯s overall radiation emissions (as measured by increasingly sophisticated satellites) have increased by 0.5% per decade, which one NASA scientist said ¡°could cause significant climate change¡± if such effects were to continue over several decades. [14] Another NASA scientist found that between 1901 and 2000, the Sun¡¯s magnetic field has increased in strength by 230 percent. [15] In 1999, a third NASA experimenter observed high increases in the amount of helium and heavier charged particles released during solar events, showing that a real change is occurring in the solar wind component of the Sun¡¯s energetic output, neatly paralleling the other observed changes.. [16]
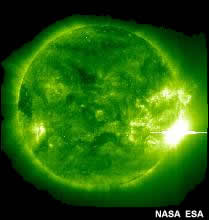
Prior to 2003, the two strongest solar flares on record were rated at a previously unheard-of X20, and occurred in 1989 and 2001. Then, in November 2003 a flare occurred that some estimate to be at least 200% more powerful than any ever seen before, at a whopping X40 ¡ or higher.[17] As is expected in such events, a coronal mass ejection soon followed ¨C releasing a huge expanding bubble of billions of tons of electrified gas into the solar system. These and other events in late 2003 caused one NASA scientist to say that the Sun is now more active than in living memory, and ¡°there has been nothing like this before.¡± [18]
Figure 5 - Largest, Brightest-Ever X40 Solar Flare, 11.5.03, (L) and Subsequent CME (R). (NASA-ESA)
Despite all of the above evidence, the case for a fundamental solar change was never truly complete until late last year, with a study that coincidentally emerged just three days before this massive solar explosion occurred. Ilya Usoskin, a mainstream geophysicist, used polar ice core samples to prove that the Sun has been more active since the 1940s than in the previous 1,150 years combined. [19] The Sun¡¯s subsequent fury, just days later, only served to underline and emphasize the point. Considering that the Sun contains fully 99.86 percent of the mass of the solar system, making the planets look like grains of sand by comparison, these continuing changes will undoubtedly affect everything within the Sun¡¯s formidable magnetic, radiative and gravitational grasp¡
Mercury
Despite huge surface temperatures, Mercury seems to have ice in its polar regions. This is blamed on comet-based ice that crash-landed into ¡°permanently shadowed craters,¡± which NASA scientists admit is a ¡°problematic¡± assumption to make; the ice supposedly has survived for millennia, whereas a NASA probe landing at the pole is only expected to survive one week in the heat. [20] Mercury also has an unexpectedly dense core of iron, consisting of almost half of its entire mass, [21] and a strong dipole magnetic field as well. Scientists would like to know how these anomalies are possible. [22]
Venus
The amount of sulfur in Venus¡¯ atmosphere was found to have decreased ¡°dramatically¡± between 1978 and 1983. [23] Unfortunately, no study we have yet located assigned a percentage figure to this planet-wide change. But in order to earn the word ¡°dramatic,¡± it could well have been a 1000-percent decrease (or more!) of sulfur compounds¡ in only five years.
This huge atmospheric ¡°global change¡± is currently blamed on a hypothetical ¡°giant volcanic eruption,¡± which released these sulfur compounds all at once into the Venusian atmosphere, sometime just before 1978 (when a fleet of US spacecraft synchronistically arrived to measure the immediate aftereffects). This anomalous sulfur then mysteriously settled out of the Venusian atmosphere at a very rapid rate. Importantly, this ¡°volcanic¡± model cannot be proven, as this alleged eruption was never seen -- either by Earth-based telescopic observations in this timeframe, or by the just-arrived Venus-orbiting spacecraft. Despite this striking lack of actual observational confirmation of such a planet-wide event, NASA simply doesn¡¯t suggest any other possible cause for such a massive, mysterious, global transformation of the entire atmosphere of Venus in only half a decade¡ [24]
Even more interestingly, Venus¡¯ overall night-side ¡°airglow¡± brightness increased by a whopping 2500 percent in roughly the same timeframe -- between 1975 and 2001. [25] The new airglow is green in color, which indicates oxygen atoms, and these oxygen emissions are as strong on Venus as they are in Earth¡¯s own oxygen-rich aurora (!); so one possible explanation is that there has been a massive increase in the oxygen content of Venus¡¯ atmosphere. [26]
We also have yet to find a single study that mentions this ¡°dramatic¡± global decrease of atmospheric sulfur in 1978-83, while simultaneous mentioning the airglow brightness increase, even though the sulfur study was published in Scientific American and other mainstream scientific sources -- as there is no current ¡°mainstream model¡± that can explain both of these changes as being part of one unified phenomenon.
The last of the six Venus images presented here (below), lower-right pane, shows a curiously geometric pattern associated with this overall 2500% airglow brightness increase ¨C a linear feature that reaches almost halfway across the visible atmosphere of the planet. This anomalous ¡°geometry¡± suggests to us that hyperdimensionally-forced ¡°fluid changes¡± in the Venusian atmosphere could somehow be associated with this dramatic brightening, based on the HD model as described above and in our previous works.
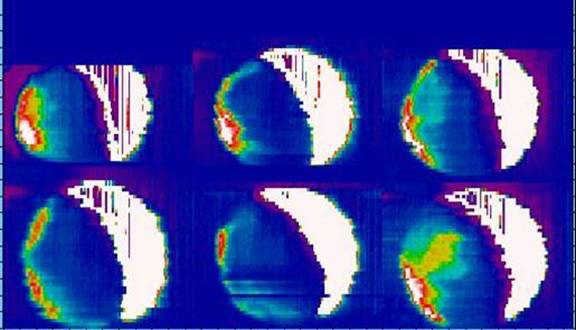
Figure 6 - Green nightglow of Venus, ANU 2.3m CASPIR, Sep. 20-26th 2002. (Jeremy Bailey / AAO)URL: http://www.ausgo.unsw.edu.au/JBailey-talk.ppt
A careful study of this 2002 image reveals that the geometric atmospheric formation observed in the lower-right pane may be caused by a tetrahedrally-shaped ¡°energy field.¡± A picture is worth a thousand words, and Figure 7 says it all. (The position and angular relationships of the linear formation mate precisely with the edge of a hypothetical tetrahedron ¡°inscribed into the sphere¡± of Venus.)
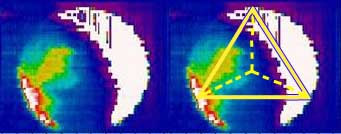
Figure 7 ¨C Green nightglow of Venus (L) and Tetrahedral Geometry (R). (Bailey/AAO/Wilcock)
(If you now go back and look at Figure 5, you can see that the unprecedented X40 solar flare is also at a perfect ¡°tetrahedral¡± point, like the white and red area at the bottom left tip (node) of the tetrahedron in this image ¨C only the solar flare is on the right, not the left. Many such ¡°tetrahedral energy node emissions¡± are visible throughout the solar system, such as the 300-year-long Great Red Spot on Jupiter and the Great Dark Spot on Neptune, and were first brought to public attention through Hoagland¡¯s HD model.)
Planetary scientists cannot explain this remarkable and totally inexplicable recent change in the intrinsic atmospheric brightness of Venus ¨C they honestly admit it¡¯s ¡°a total surprise,¡± with ¡°no easy explanation.¡± [27] [28] One NASA/Caltech scientist even went so far as to say that ¡°something weird is going on in the upper atmosphere of Venus,¡± adding that ¡°the bottom line is that we just don¡¯t know what¡¯s going on.¡± [29]
Yet another sign of a massive overall increase in the energetic behavior of Venus was revealed in 1997. A tail of charged plasma trailing behind Venus was measured to be 60,000 percent longer in 1997 ¨C stretching almost to the Earth ¨C than where it was first discovered in the late 1970s. According to one NASA/JPL scientist, this tail is ¡°a really strong signal, and there¡¯s no doubt it¡¯s real.¡± [30]
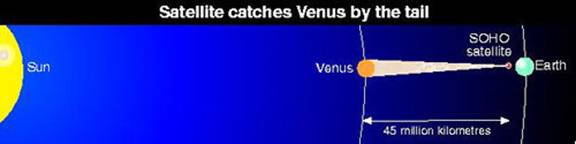
Figure 8 - Huge Charged Plasma Tail from Venus Extends to Earth (New Scientist, 1997)
All of these changes in the Venusian environment can be seen as part of a larger, hyperdimensional charge-up affecting the entire solar system -- which will become increasingly clear as we continue with more data.
Mars
Between the mid-1970s and 1995, Mars developed significant new cloud cover, had an overall reduction in atmospheric dust content, and revealed a ¡°surprise ¡ abundance¡± of ozone in its atmosphere. [31] NASA¡¯s Mars Global Surveyor unmanned spacecraft was damaged in 1997 by an unexpected 200% local increase in the density of Mars¡¯ atmosphere. [32] In 1999, a hurricane appeared on Mars for the first time in over 20 years (Figure 9), and was 300% larger than any previously seen. To compare it to the Earth, this hurricane was 400% larger than the state of Texas. [33]
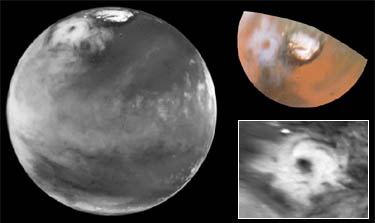
Figure 9 - Giant Hurricane on Mars (NASA/HST 1999)
Though many would like to believe that a fast-acting ¡°global superstorm¡± is science fiction, a powerful global dust storm engulfed the entire planet of Mars in only three months of 2001, as Figure 10 (below) clearly demonstrates. The official Hubble Space Telescope website described this event as the ¡°biggest global dust storm seen on Mars in several decades,¡± with unusually energetic behavior, including a speed of travel across Mars¡¯ equator that was ¡°quite unheard of in previous experience¡±. The description ¡°in several decades¡± implies that this is the biggest storm in at least 40 years, if not more. Especially interesting is a statement describing this as part of an ¡°abrupt onset of global warming in Mars¡¯ thin atmosphere,¡± the study of which a NASA scientist from Cornell described as ¡°the opportunity of a lifetime.¡± [34]
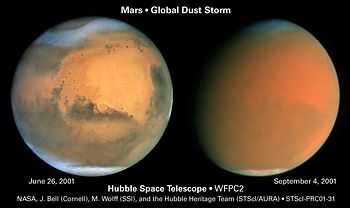
Figure 10 - Planet-Wide Dust Storm on Mars, June 26, 2001 (L) and Sep. 4, 2001 (R). (NASA/HST/WFPC2)
In 2001, mainstream media awoke to ¡°Global Warming¡± on Mars, including dramatic year-to-year losses of snow cover at the south pole, with rapid erosion of specific icy features. [35] Interestingly, NASA admitted earlier that an underlying geometric structure was somehow involved in the retreat of the icecap. A hexagon-shaped pattern in the ice can clearly be made out in the middle image from January 1997, and is also visible (though rotated counterclockwise a bit) in the left image from October 1996.
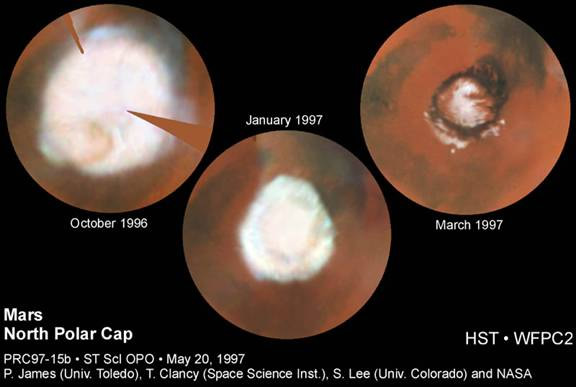
Figure 11 - Mars¡¯ North Polar Cap Retreat, Showing Hexagonal
¡°Wave Structure,¡± Oct. 1996- March 1997. (NASA/HST/WFPC2)
Also interesting is that this Martian geometry has appeared on at least two previous occasions as well, in 1995 and 1972. According to NASA, there is a ¡°marked hexagonal shape of the polar cap at this season, noted previously by HST in 1995 and Mariner 9 in 1972; this may be due to topography [the shape of Mars¡¯ lithospheric crust], which isn¡¯t well known, or to wave structure in the circulation.¡± [36]
In this case, we wholeheartedly agree with NASA.
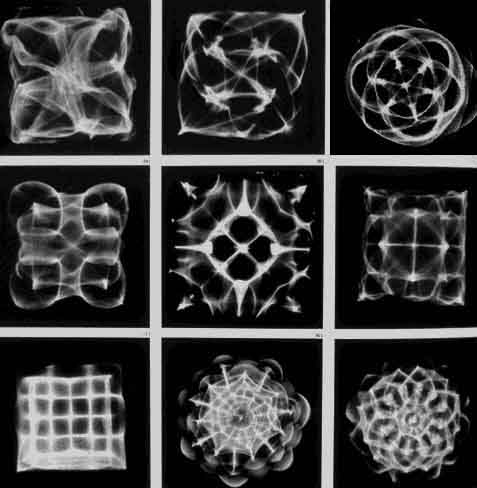
There does indeed seem to be a geometric wave structure affecting the retreat of Mars¡¯ icecaps as the planet generally heats up. Many scientists are not familiar with three-dimensional wave structures, but they form when any fluid is vibrated. [37] Remember, in the Hyperdimensional Model, the ¡°fluid¡± that we are looking for is not normally detectable ¨C it is a hyperdimensional force that ¡°bleeds through¡± into our reality via the three-dimensional, massless aether¡ the invisible ¡°fluid¡± permeating all of space which, in turn, then reorganizes visible structures of matter and energy in this dimension. In this case, the HD transfer path is strong enough to reorganize the ¡°cold¡± pattern of change in Mars¡¯ icecaps along resonance/geometric lines, just as the same HD geometry may be organizing the ¡°hot,¡± rapidly-increasing green oxygen emissions in the Venus¡¯ atmosphere.
Overall, Mars satisfies our model quite well. Ozone is up and dust is down, both indicating that increased ionization is taking place ¨C a sign of energetic bleed-through in the HD model. The atmosphere is noticeably cloudier and denser, a massive hurricane and a surprisingly fast-moving planet-wide dust storm have dazzled NASA scientists, and ¡°Global Warming¡± has been announced from more than one major mainstream Martian study. The retreat of Mars¡¯ surface icecaps is seen to be literally shaped by an unseen geometric ¡°wave structure.¡± Again, these changes are not unique to Mars ¨C they are occurring simultaneously throughout the solar system; the formidable data on Jupiter makes this developing trend emphatically apparent.
Jupiter
Equally mysterious geometric effects have been discovered in Jupiter¡¯s atmosphere, and reported with little fanfare by NASA. Though the scientists refer to the atmospheric structure in Figure 12 as a ¡°quasi-hexagon,¡± it is also possible within the limitations of the current data to perceive a five-sided pentagon in the Jovian polar cloud structures. What makes this so stunning is that this stable, slowly-rotating feature of Jupiter¡¯s northern polar region creates a ¡°sharp temperature drop¡± within its neat, geometric boundaries, keeping ¡°the polar atmosphere and stratospheric haze isolated from the rest of the atmosphere.¡± (One of us -- Wilcock -- believes it is possible that we are seeing one face of another embedded, resonant 3D geometric shape, known as a ¡°dodecahedron,¡± which is a twelve-sided object, shaped like a soccer ball, where each side is a perfect pentagon.) Using Photoshop, he added in the geometrically-perfect ¡°exposed pentagon¡± for reference on the left image:

Figure 12 - Jupiter¡¯s Arctic Polar Vortex (NASA/JPL/HST/University of
Hawaii 1999) with Added Pentagon on Left (Wilcock 2004)
NASA discussed this anomalous formation openly, and even mentioned geometry, but only went so far as to suggest that it was a ¡°quasi-hexagonal shape¡± inside instead of making any mention of its equally possible pentagonal structure. [38]
Remember when we were discussing the mysterious appearance of ice at the polar regions of sun-baked Mercury? At that time, we hinted that there might be a hyperdimensional ¡°shielding effect¡± that is protecting this region from the natural heat of the sun, introducing its own mysterious ¡°refrigerator¡± mechanism. In Wilcock¡¯s interpretation of the Jovian clouds, the pentagonal ¡°wave geometry¡± seems to be another signature of equally anomalous cooling in the Jovian polar regions, whereas we saw the already low-temperature polar areas of Mars contained by a hexagonal surface pattern. It seems reasonable to conclude from this growing evidence that a planet¡¯s surface or atmospheric heating pattern can be more affected, at times, by its resonant internal aether ¡°geometry,¡± than by direct external solar radiation.
If Jupiter is indeed experiencing a hyperdimensional ¡°charge-up,¡± in the HD model we might expect to see a literal vortex phenomenon appear at some time near one of the nodes (points) of this northern pentagon. A movie made from about 1,200 images of Jupiter taken by NASA¡¯s Cassini spacecraft in late 2000 reveals exactly this ¨C a dark vortex as large as Jupiter¡¯s Great Red Spot, at the same latitude (60 degrees N) as the pentagon¡¯s points! This node developed a bright spot in the center and then elongated along a straight-line pattern, consistent in its size and angle with the pentagon, with yet another parallel straight line appearing closer to Jupiter¡¯s pole. A Space Daily article mentions this as ¡°unexpectedly persistent polar weather patterns on the giant planet,¡± where ¡°the movie shows that the small spots last a long time and move in organized patterns.¡± [39] No comment is made, however, on how the lines that are formed are anomalously straight and parallel -- rather than following the usual curved paths of typical cloud movements (See Figure 9.)
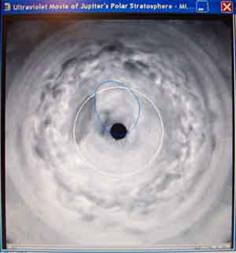
Figure 13 ¨C Straight-line formations in Jupiter¡¯s northern hemisphere. (NASA/JPL/SwRI, 2002)
The NASA text for the movie itself describes ¡°the birth and motion of a dark vortex wider than Earth,¡± where ¡°a dark patch appears and within two weeks becomes a well-defined oval about the same size and shape as Jupiter¡¯s southern hemisphere Great Red Spot. While this dark vortex is nestled inside the auroral oval, its outer edge begins to circulate in a clockwise direction as it simultaneously develops a small, brighter, inner core. It eventually moves out of the auroral region and deforms by flattening in latitude and growing in longitude. Near the end of the movie, a second, smaller, dark oval appears nearer to the pole and deforms in the wind shear.¡± [40]
A published study by Dr. Carolyn Porco and others on this event noted, ¡°Other evidence suggest that large oval formation in the polar regions is a recurring phenomenon ¡ which may be quasi-periodic, or rare but recurring, and triggered by an unusual auroral event¡ However, the evolution of the dark oval is currently unexplained.¡± [41] 
So, we have the emergence of a giant vortex phenomenon, showing clear signs of consistent geometry, in a region that NASA already admitted as hosting a ¡°quasi-hexagonal¡±, i.e. pentagonal, shape in the upper-level clouds. Though some may clearly wish to argue that this is foolish ¡°pattern seeking,¡± once again we have clear evidence of an increase in Jupiter¡¯s energetic atmospheric activity, occurring along internally consistent, geometrically-defined (resonant ¡°standing wave¡±) patterns¡
We are not the only authors to suggest that changes in Jupiter¡¯s vortex phenomena could be related to an overall energetic increase. A major new study on Jupiter actually made it into the April 22, 2004 edition of USA TODAY, announcing the surprise disappearance of several major oval formations in Jupiter¡¯s atmosphere (Figure 14) -- between September 1997 and September 2000. The study demonstrated that without these vortices in place, internal Jovian heat will not be released as efficiently into space as before¡ and Jupiter will likely experience substantial ¡°global warming¡± within the next 10 years ¨C a whopping projected temperature increase of 18 degrees Fahrenheit, or 10C. [42]

Figure 14 - Disappearance of white vortexes in Jupiter¡¯s middle latitudes. (NASA/HST 2004)
The planetary scientist behind this study also notes that the Great Red Spot has changed from its traditional red to ¡°something more like salmon,¡± and believes that this color change may also be due to an overall increase in Jupiter¡¯s temperature. [43] These changes are theorized to be part of a 70-year cycle, which is believed to have started when the three largest ovals first appeared in 1939. What we see now may well be just the beginning. The disappearance of the vortices between September 1997 and September 2000 may be directly related to the appearance of the even-larger polar vortex in Jupiter¡¯s northern hemisphere just days later, which was filmed from October 1st to December 31st 2000. (Figure 13)
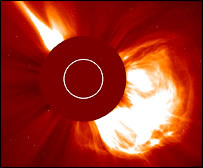
The shift in vortex activity from the middle latitudes of Jupiter to the polar latitudes is just one of a variety of clearly measurable changes that are taking place in the largest known planet of the solar system. Figure 15 shows a tube-shaped cloud of hot plasma that was first discovered surrounding Jupiter in 1979. NASA¡¯s Pioneer 10 and 11 probes detected nothing of the sort in 1973-74, which means that this major Jovian system feature, again, emerged in only five years¡¯ time. [44]
Figure 15 - Plasma tube (torus) in the orbit of Jupiter¡¯s moon Io. (NASA/HST)
If we remember that this ¡°tube¡± did not exist at all as of 1974, this next fact again makes it crystal clear that major energy changes are occurring in and around Jupiter. In 1994, the multiple fragments of comet Shoemaker-Levy 9 slammed into Jupiter, causing quite a celestial spectacle -- as many dark, atmospheric ¡°holes¡± were created by the extraordinarily energetic impact effects in the upper Jovian atmosphere. With the impact of the ¡°K¡± fragment, a truly amazing thing happened ¨C two arcs of charged plasma burst out of the planet and maintained a visible structure for about an hour. Though it seems hard to believe (and admittedly it is a poor-resolution image), Figure 16 is exactly as it appears on the official JPL website [45]:
Figure 16 ¨C Auroral emission arcs from Jupiter after
SL-9 ¡°K¡± impact, July 19, 1994. (NASA/HST/WFPC2)
Even more interestingly, the JPL report states that ¡°Based on comparison with ROSAT satellite X-ray images of Jupiter also taken at time of the K impact, astronomers know that the northern disturbance was brightest near the time of the K impact, and then faded. If HST images had been taken during the K impact, they would likely have shown far brighter arcs than those observed 45 min. later [in the image].¡± ¡°Far brighter¡± is quite an unsubtle statement for NASA to make. Figure 17 shows us the ROSAT image that the JPL report is referring to when making this bold statement.
Figure 17 ¨C ROSAT X-ray images of energy emissions from
Jupiter during ¡°K¡± impact of Comet SL9. (NASA/JPL 1994)
The way the article is written indicates clearly that these arcs (Figure 16) were a relatively new phenomenon, never before seen with such intensity, which appear to have been first observed by the Hubble Space Telescope in May of 1994. However, a single ring of this type became a stable, ongoing feature of Jupiter after the July 19, 1994 impact. It was first detected earlier that May, and filmed over time, with far better resolution, between May 1994 and September 1995. [46] This ring emanates from the polar regions of Jupiter over to the polar regions of the closest moon Io, linking the two together like beads on a bracelet. This tube of energy is equal in its strength to all the manmade power on Earth. Surprisingly, this ring exerts a strong enough influence on Jupiter¡¯s polar regions that it actually bends the cloud flow towards Io. We have not altered this image in any way ¨C what you see is exactly as it appeared on the Hubble website [47]:
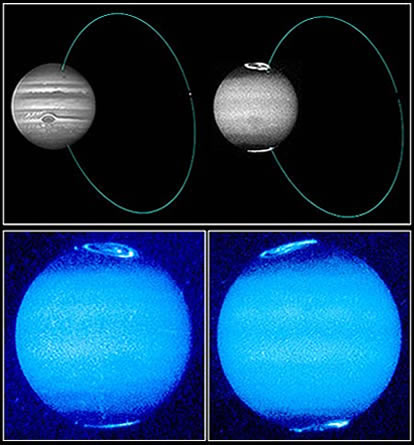
Figure 18 - Jupiter¡¯s Aurorae and their Ring-Shaped Formation with Io. (NASA/HST 1995)
Another interesting point about this energy ring is that NASA now knows that electrons are flowing through it in both directions ¨C north to south and south to north. NASA scientists call them ¡°bi-directional electrons.¡± Conventional models have no explanation for this phenomenon, but it fits perfectly with Wilcock¡¯s basic model as expressed in his third volume, The Divine Cosmos, once we understand the importance of counter-rotating energy fields in all physics. (http://ascension2000.com/DivineCosmos)
In 1995, the Galileo probe arrived at Jupiter, and began measuring a variety of changes. Jupiter¡¯s atmosphere was discovered by NASA scientists to be hundreds of degrees hotter than anticipated. [48] The amount of heavy elements (such as oxygen) in Jupiter¡¯s atmosphere decreased by a stunning 10% between 1979 and 1995, which is equivalent to 20 Earth-masses of oxygen ¡°embarrassingly¡± disappearing in 16 years. [49] [50] Radiation emissions from Jupiter simultaneously increased by about 25% between 1979 and 1995. [51]
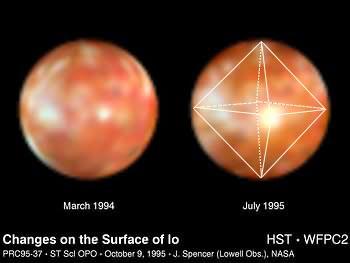
Jupiter¡¯s closest moon is Io, the most volcanically active satellite in the solar system. Let¡¯s not forget that the impact of Comet SL-9 triggered a huge energetic increase in Jupiter, beginning on July 19, 1994 with the ¡°K¡± impact and the resulting ¡°auroral emission arcs,¡± (Figure 17), one of which streamed into the north and south poles of Io and revealed itself to be a stable, ongoing feature thereafter. One year later, in July 1995, Io had developed a huge, bright, 200-mile-wide feature¡ not at the polar regions where the bright arc of energy was entering, but directly along the equator! This was a more dramatic change than any seen in the previous 15 years. [52]

Figure 19 - Unexplained 200-mile-wide ¡°Hotspot¡± on Io Emerges
over 16-Month Period (NASA/HST/WFPC2, 1995)
This circular formation of sudden, inexplicable brightness fits perfectly with the HD model ¨C in this case, showing us the ¡°pure¡± geometry of a higher energy ¡°octahedral resonance pattern¡± emerging at one of its points along the equator of Io. The HD energy entered into the moon in the polar regions, and then through the angular momentum of the moon¡¯s rotation, burst out at the equator at a geometrically-defined point, similar to a lawn sprinkler throwing off water. [53]
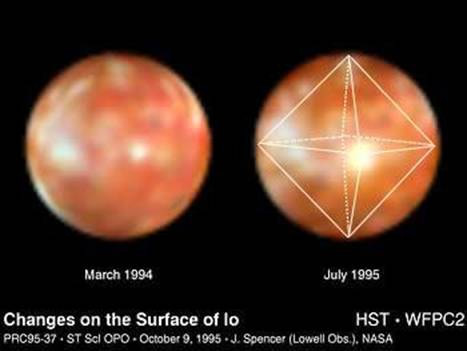
Figure 20 - Octahedral Geometry in 1994-95 Io Brightness
Increase. (Wilcock, 2004 with NASA/HST, 1995)
NASA¡¯s Hubble Site said that up until this bright feature emerged at the equator, ¡°Io¡¯s surface had undergone only subtle changes since it was last seen close-up by the Voyager 2 probe in 1979.¡±
[54] However, just one year later, JPL said that ¡°the changes we are seeing on Io are dramatic¡ The colors of material on the ground and their distribution has changed substantially since the Voyager flybys of 1979.¡±
[55] Did this change happen in one year, or are the Hubble and JPL scientists simply interpreting the data in different ways? This ¡°dramatic¡± color change on Io could indicate that new types of matter are being released from the volcanoes themselves, in just 17 years.
Even more interestingly, NASA actually admitted in 2000 that Io behaves ¡°as though it were a fluid,¡± [56] which we believe is partly responsible for the emergence of otherwise-unexplained geometric effects. As a further support to the fluid concept, ¡°In a 42-hour span, every point on Io goes from high tide to low tide, with its rocky surface rising and falling by up to 300 feet (90 meters) or more¡ This constant tidal motion is what triggers the endless volcanoes.¡± [57]
Another suggestion of the hyperdimensional geometry of the octahedron at work on Io was spotted in 1997. As can be easily seen in detailed images of Io¡¯s surface, the volcano Prometheus sits directly on the equator, suggesting (in the HD model) that it is caused by an internal ¡°octahedral¡± geometric wave -- similar to how Mars, Venus and Earth all show substantial volcanic activity at the 19.5-degree ¡°tetrahedral¡± latitude. According to NASA, an ¡°intriguing difference¡± appears in Prometheus between 1979 and 1997: the volcano is ¡°now erupting from a position about 75 kilometers (46.5 miles) west from where the hot spot resided in 1979.¡± [58]
Volcanoes are not supposed to get up and gallop 46.5 miles along the surface of a satellite in conventional models, (!), but if Prometheus is a sign of octahedral vortex activity, it is possible that the geometric wave is slowly rotating within Io itself. The Hawaiian Islands on Earth, clustering in a long chain at the critical 19.5-degree latitude, may be another example of such changes¡ except that with the Earth¡¯s harder, cooler crust, the old volcanoes remain in place as the vortex slowly travels.
The comet impact, energy ring and subsequent geometric ¡°pressure release¡± of Io in 1995, as well as the volcanic anomalies, are only one aspect of a larger change on and around Io¡ though this chain of events may have signaled an important turning point in Io¡¯s energetic transformation. Io¡¯s ionosphere became 1000% higher between 1973 and 1996, from 30-60 miles to 555 miles in height. [59]
Io¡¯s
surface became over 200% hotter between 1979 and 1998, sporting a temperature over three times hotter than the sunlit surface of Mercury ¨C and according to NASA, ¡°Scientists don¡¯t yet know how to explain what is happening on Io.¡±
[60] In 2000, NASA also admitted that ¡°most of the heat [is coming] from Io itself, rather than absorbed sunshine.¡±
[61] New colors [spectral evidence of new ions in the Io environment, not present before¡ ] were seen in Io¡¯s
aurorae in 1998.
[62] Yet additional new colors were discovered in 2001.
[63][64]
In early January 2001, Io had an inexplicable ¡°bright spot¡± emerge in ultraviolet wavelengths during an eruption of its volcano Pele, which sits at about 19.5 degrees south latitude. According to NASA, ¡°silicate lava cannot be hot enough to explain a bright spot in the ultraviolet, so the origin of this bright spot is a mystery.¡± [65] This same article also presents ¡°the first image ever acquired of an active [volcanic] plume over a polar region of Io.¡± [66] (See Figure 21.) ¡°Scientists were astounded to discover so large a plume so near the pole, because all active plumes previously detected on Io have been over equatorial regions and no others have approached Pele¡¯s in size.¡± [67] Volcanoes in the polar regions make no sense to mainstream scientists, but are an obvious consequence of the HD model, since there are geometrically-defined vortexes there.
On Aug. 6, 2001, a ¡°previously undiscovered and still unnamed volcano¡± (read: brand new), released a 310-mile-high plume, ¡°making this the largest plume ever detected on Io.¡± [68] (See Figure 21.) How, in conventional models, would a brand-new volcano suddenly emerge on the surface of a satellite and then release the highest plume of gas and dust ever seen there?
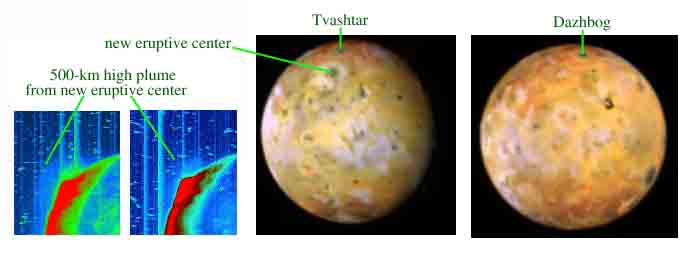
Figure 21 ¨C New Volcano on Io Releases Largest Plume Ever Seen, Aug. 2001 (NASA)
The roughly 60-degrees-north geometric position of the new volcano strongly suggests that it could be caused by the same pentagonal (dodecahedral) polar geometry that we see in Jupiter¡¯s northern hemisphere¡ a geometry that had fired into action beginning in October 2000, just after the white vortices finished vanishing from the middle of the planet in September 2000. Perhaps it took a little less than one year for this hyperdimensional shift of Jupiter to be ¡°gated¡± over to Io, causing a very similar energetic effect there ¨C the most massive volcanic eruption ever observed.
As we saw in Figure 15, a donut-shaped tube of glowing plasma energy fills the entire path of Io¡¯s orbit. Scientists think this tube is caused by charged particles spewing from Io¡¯s volcanoes. The charged particles in this tube became 50% denser between 1979 and 1995. [69] The overall density of the tube increased by 200% between 1979 and 1995, [70] and as we saw earlier, the tube itself did not exist prior to 1979. A ¡®cold¡¯ portion of the tube separated itself out and became significantly brighter between 1999 and 2000. This most recent change led NASA scientists to conclude that ¡°sufficient data are probably not available to determine the cause or effect of the torus (plasma tube) variability.¡± [71] This is a very polite way of saying, ¡°We just don¡¯t know what the hell, scientifically, is going on!¡±
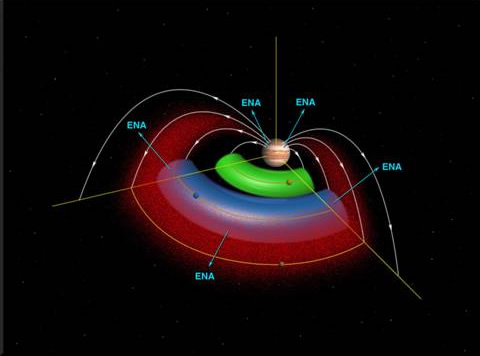
Figure 22 - Io plasma torus (green) and newly discovered Europa
plasma torus (blue) surrounding Jupiter. (NASA 2003)
Confounding the mainstream models even further, another ¡°large and surprisingly dense¡± plasma tube was discovered in 2003 (Figure 22), this time, sharing the orbit of the moon Europa. In this case, there are no volcanoes on Europa¡¯s surface that could account for where the charged particles in the tube are coming from, despite the fact that conventional Jovian system models insist that volcanoes have to be the main source of the new plasma. [72] Further underlining these dramatic changes, as of about 2003, Europa¡¯s aurora was observed to have ¡°a much brighter region¡± than it was ¡°expected¡± to have, based on a 1998 model (Figure 22). Again, the picture (below) says it all. [73]
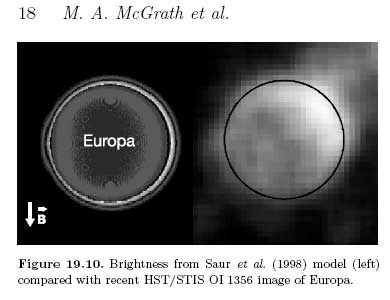
Figure 23 - Difference between theoretical model of Europa¡¯s brightness
with actual HST observations. (NASA/HST/McGrath et al. 2004)
Jupiter¡¯s third moon, Ganymede, became over 200% brighter in its aurora between 1979 and the mid-1990s, and certain areas are now up to 700% brighter than any before seen (Figure 24). [74] This increase in brightness may be caused by an observed 1000% increase in the density of Ganymede¡¯s atmosphere since 1979. [75] Ganymede also has its own magnetic field, in defiance of all conventional expectations, leading one NASA scientist to say, ¡°Either something¡¯s wrong with our [internal dynamo] theory, or our understanding of Ganymede¡¯s history.¡± [76]

Figure 24 ¨C Green Oxygen Aurora Brightness on Ganymede (NASA/HST/McGrath et al. 2004)
At the orbit of Jupiter¡¯s fourth major moon, Callisto, electron density measurements made by the Galileo spacecraft found 1000 times more electrons per cubic kilometer than expected from Jupiter¡¯s own magnetosphere at that great distance. [77] This strongly indicates some type of material (probably water) is currently being liberated from Callisto, despite no observations of associated volcanic activity, et cetera. When ionized by Jupiter¡¯s own radiation belts, this material would release excess electrons in direct proximity to Callisto¡¯s orbit -- another, albeit indirect, indication of enhanced energy being deposited inside Callisto from ¡°somewhere.¡±
Furthermore, when Galileo was on its way towards Callisto on August 12, 1999, before making its closest approach two days later, it encountered what NASA called an ¡°unexpected whopper dose of radiation.¡± One scientist said, ¡°We anticipated the spacecraft¡¯s star scanner would detect about 300 to 400 pulse counts of radiation, so imagine our surprise when the instruments showed Galileo had flown through 1,400 pulse counts!... Then again, that¡¯s why we¡¯re exploring Jupiter and its moons -- to discover these unusual phenomena.¡± [78] The radiation caused four different spacecraft faults that were able to be handled by onboard software, which included disabling one backup spin detector that had been damaged in the event.
This unexpected radiation blast ¡°took place one week after the largest heat output since 1986 from Jupiter¡¯s volcanic moon Io.¡± It may be significant that all these events clustered around the Grand Cross astrological event of August 1999, where many of the planets were in hyperdimensionally dissonant 90 and 180-degree angles to each other.
As we head even farther away from the center of Jupiter, a new ¡°dust ring¡± was discovered encircling the planet in 1998 -- and, in defiance of all expected celestial mechanics, its particles orbit in the opposite direction to Jupiter¡¯s own rotation, and the orbital direction of its major satellites. [79] Again, counter-rotating fields are a basic aspect of Wilcock¡¯s hyperdimensional model. [80]
In the course of our research for this article, we dug up two other Jupiter anomalies that support Hoagland¡¯s hyperdimensional model, based on the geometry of the tetrahedron inside a sphere, as seen in Figures 3 and 4. We have put these anomalies at the end of this section since they do not precisely show a change in Jupiter¡¯s energetic activity, but simply demonstrate the underlying ¡°new¡± physics at work.
First, in an article from Science magazine in March 2003, a diagram is shown of the velocities of Jupiter¡¯s cloud bands, based on latitude. The fastest and slowest cloud speeds on Jupiter occur at exactly 19.5 degrees north and south, respectively. These speed anomalies have shown remarkable persistence -- they were there when Voyager 2 visited Jupiter in 1979, and the latest Cassini data of 2003 continue to show the same phenomena. According to the NASA scientist working on this, ¡°The stability of Jupiter¡¯s zonal winds, given the turbulent nature of its cloud patterns, is a remarkable feature of its atmosphere.¡± [81]
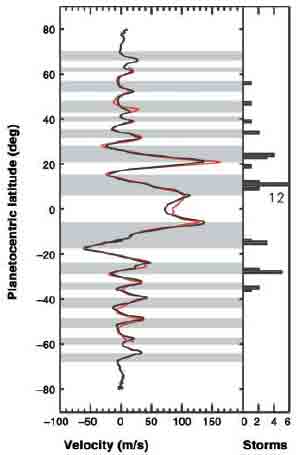
Figure 25 - Graph of Highest and Lowest Wind Speeds on Jupiter,
Showing Activity at ¡°Hyperdimensional¡± Latitudes (Porco et al. 2003)
The ¡°hyperdimensional bleed-through¡± geometry of the tetrahedron appears to be creating the Great Red Spot in Jupiter¡¯s southern hemisphere at 19.5 degrees S and slowing down the speed of the cloud rotations at that latitude. If this formation does truly exist, then it would also come to a point at the geometric north pole of Jupiter. Interestingly, a recent study has found that in approximately 45-minute intervals, flashes of X-ray activity are emerging from the geometric north pole of Jupiter¡ even though Jupiter¡¯s aurora is not centered on the pole, as we can see in Figure 26. The energy released by this point is equivalent to a colossal gigawatt pulse of energy rocketing through the solar system. [82]
A NASA article discussing this phenomenon says the following: ¡°We weren't surprised to find x-rays coming from Jupiter, he [Dr. Randy Gladstone] continued. Other observatories had done that years ago. The surprise is what Chandra has revealed for the very first time: the location of the beacon -- surprisingly close the planet's pole -- and the regular way it pulses¡
The 45-minute pulsations are very mysterious, adds Elsner. They're not perfectly regular like a signal from E.T. might be; the period drifts back and forth by a few percent. This is a natural process, he adds, we just don't know what it is... (emphasis added)
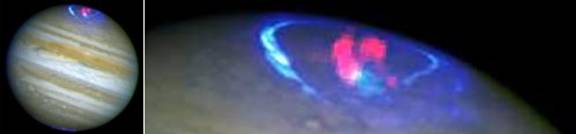
Figure 26 - Composite Image ¨C Jupiter, Glowing Auroral Ring (Blue) and Polar X-Rays (Red) (NASA 2002)
With Jupiter, the geometric fingerprints of hyperdimensional energy are very clear. In the image on the right in Figure 25, we can see that the fine lines of the X-rays (in false-color red) actually look like the top of a tetrahedron, other than the large vertical straight-lined area of extra brightness to the left. The large circular bright area to the right would be the top of the tetrahedron, and two lines are seen to extend downward from it in a triangular fashion, maintaining a 60-degree angle from each other as we would expect.
This X-ray phenomenon occurs 15 times for every rotation of Jupiter on its axis. More research will probably provide an answer to what is causing the cycle, (we do have ideas, such as varying ¡°hyperdimensional¡± angles caused by the orbits of the four main moons of Jupiter,) but the area where the X-rays are emanating from is clearly geometric¡ rather than being in alignment with the center of Jupiter¡¯s electromagnetic aurora.
So, to summarize and review what we have just learned, in just the last 30 years overall, Jupiter and its satellites have undergone a remarkable series of energetic and hyperdimensional changes. Vortexes are disappearing from Jupiter¡¯s middle latitudes and reappearing at geometrically-defined points in the polar regions. A plasma tube in the orbit of the moon Io has shown remarkable increases in brightness and density. Jupiter¡¯s atmosphere has experienced huge decreases in heavy elements and increases in helium, and overall radiation emissions have increased.
A comet impact caused huge, bright arcs to surge out of Jupiter, one of which connected with Io and remained stable. The HD energy streaming in at the north and south pole was redirected to a perfectly geometric, single 200-mile-wide point at the equator. New colors were seen on Io¡¯s surface and the largest volcano ever seen appeared for the first time less than a year later. Io¡¯s ionosphere became much higher, the surface became hotter, and new colors were seen in the aurora. Europa was also found to have a mysterious tube of energy in its orbital path, and was recently observed to be far brighter than expected. Ganymede¡¯s aurora also brightened substantially, possibly indicating an atmospheric density increase. Callisto¡¯s aurora was fully 1000 times stronger than expected, and nearby radiation levels were as much as 467% higher than expected. Another giant tube of energy was found beyond the orbit of Callisto, and was inexplicably counter-rotating.
The slowest cloud speeds are at 19.5 degrees south latitude, and the fastest cloud speeds are at 19.5 degrees north, in precise alignment with the Hyperdimensional Model. A whopping gigawatt-sized X-ray pulse emerges from the exact geometric north pole of Jupiter every 45 minutes, showing us the top of the same tetrahedral energy field that emerges as the Great Red Spot¡ which is large enough to hold two Earths.
Taken together, these findings demonstrate the remarkable geometric properties of Jupiter, and an undeniable evolution in the basic nature of its temperature, composition and energetic behavior as a system. As we move on into Part Three of this Report, we will discover that every other remaining planet¡ Saturn¡ Uranus¡ Neptune¡ Pluto¡ Earth¡ is showing us similar types of changes, thus truly demonstrating that we are dealing with an interplanetary transformation. We will also see evidence from studies of Earth that show how the changes we experience here are directly correlated with changes in the greater solar system.